Reports
The summary includes a time section, allowing you to view statistics over a defined period or your entire Tablein lifetime.
With the simple time selection option, you can see detailed information for preferred time periods or specific days.
By default, the system shows statistics for a 15-day period: 7 previous days, today, and 7 upcoming days.
Select a period using the dropdown menu at the top right corner to overview the preferred timeframe. You can choose a preset period from the dropdown or select 'Custom' to pick specific dates on the calendar.
Click to reset and select a new period at any time.

Reservation Overview and Guest Statistics
This section shows the number of guests and provides an overview of various statistics. In the reservation overview, you can view the following statistics:
- Total guests
- No-shows (%)
- Cancellations (%)
- Average party size
- First-time visitors over the period (%)
You can use your mouse cursor to navigate each day to view detailed statistics by day.

Most Booked Hours
Discover your most popular days and times in the Most Booked Hours summary.
- View Statistics: Select a defined period or your entire TableIn lifetime, then click on days to view your statistics day-by-day or across weeks.
- Optimize Offers: This vital information will help you identify the best times to run special offers and discounts.
- Today's Service: To see how many guests you have during today's service, select the current date from the period selection. Only the hours for that day will be displayed.

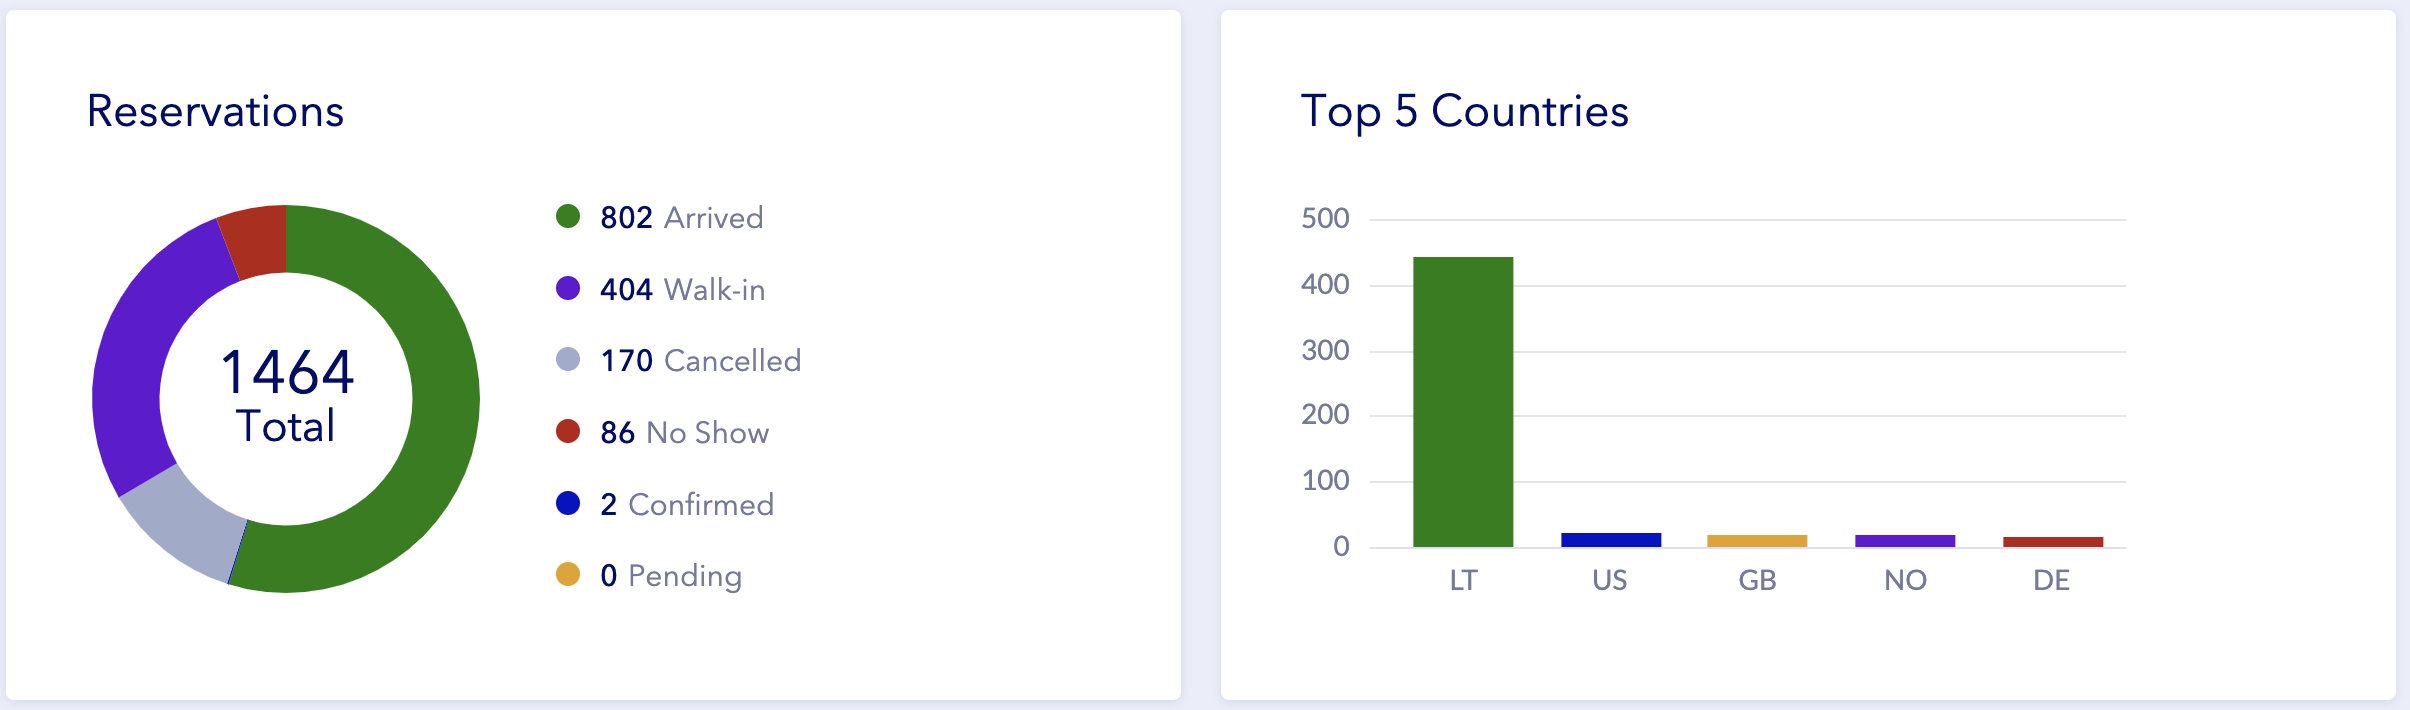
Reservation Statuses
In addition to showing the number of guests, the reservation overview provides detailed information on the number of reservations.
Displayed in a colorful diagram rich with information, you’ll be able to see exactly how many no-shows, cancellations, and arrivals your restaurant has had in period.
Top Countries
TableIn also tracks where your guests are from. The Top Countries option displays up to five countries, showing which nationalities book most often, among other insights.
This information allows you to customize your widget to these languages, making it easier for those guests to book.
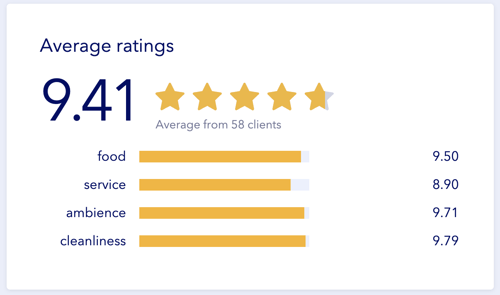
Average Rating and Feedback
Benefit from rating statistics to improve your service.
- Discover Areas for Improvement: Use data to understand where and how you can enhance your service.
- Filter Data: View feedback through helpful filters, including time periods, to see how feedback varies depending on times, days, or periods.
- Real-Time Updates: Your most recent feedback will also be displayed on your dashboard in real-time, making it available to you at a glance.

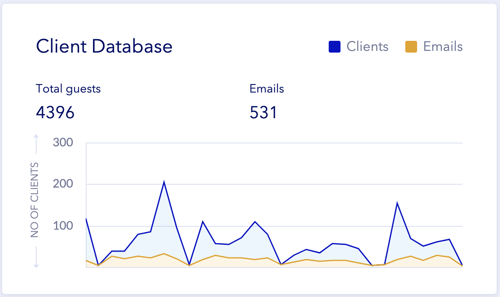
Subscribed Client Database
Allow your guests to choose if they want to receive your newsletter. At a glance, you can see how many subscribed clients you have and compare this with the total email count. This helps you understand if clients are interested in your news.
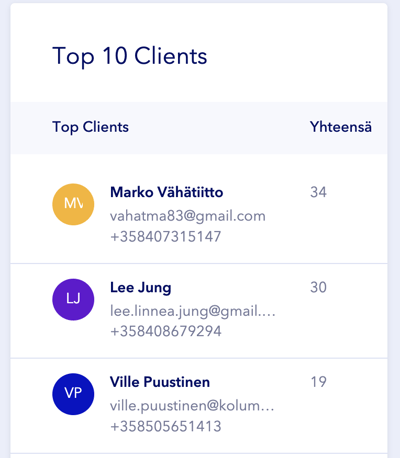
Top Loyal Clients
Reward your loyal clients with delicious gifts, extra attention, or a glass of their favorite wine. Loyal clients are your most valuable customers.
The top loyal client system counts guests with an "Arrived" status.